
The number that quietly moved
Consider a team that reports good news: a new drafting setup is twice as fast and roughly half the token cost per attempt. Nobody has touched the review process. A few weeks later, in this hypothetical, the humans doing review are behind, and nobody can say why, because the dashboard everyone is watching still shows the generation line going down. A cost improvement in one stage of a pipeline can produce a cost increase overall, and the only way to see it is to stop pricing attempts and start pricing accepted outcomes.
The mechanism is the same distinction between total cost, marginal cost, and decision-relative cost worked through in the companion article on agent economics — see Price the Agent Work You Can Verify. That piece prices a single task; this one applies the same discipline to a queue, where the denominator itself, how many outputs actually get accepted, is the variable that moves when you change models, prompts, or review criteria.
Calculating AI human review cost
An AI review queue is any pipeline where a model produces a draft, a human or a check evaluates it, and only accepted drafts count as finished work. Three quantities matter:
- Attempts: how many drafts get generated in a period.
- Acceptance rate: the fraction of attempts that pass whatever gate you use — a schema check, a human sign-off, a test suite.
- Cost per stage: generation cost per attempt, and review cost per attempt (whether accepted or not, because rejected drafts still get reviewed before rejection).
The quantity you actually want is cost per accepted item, defined as:
cost per accepted item = (total generation cost + total review cost) / number of accepted items
Include the cost of rejected attempts in the numerator. If no items are accepted, the ratio is undefined: report the spend and zero accepted output rather than assigning a misleading zero cost.
Working the sensitivity table
Here is a bounded, invented teaching scenario, using round numbers in one abstract currency unit so the arithmetic is easy to follow. It is not a measured result from any deployed system.
Baseline: 100 attempts, generation costs 10 units total (0.10 per attempt), review costs 50 units total (0.50 per attempt), and 80 of the 100 attempts are accepted.
total cost = 10 + 50 = 60
cost per accepted item = 60 / 80 = 0.75
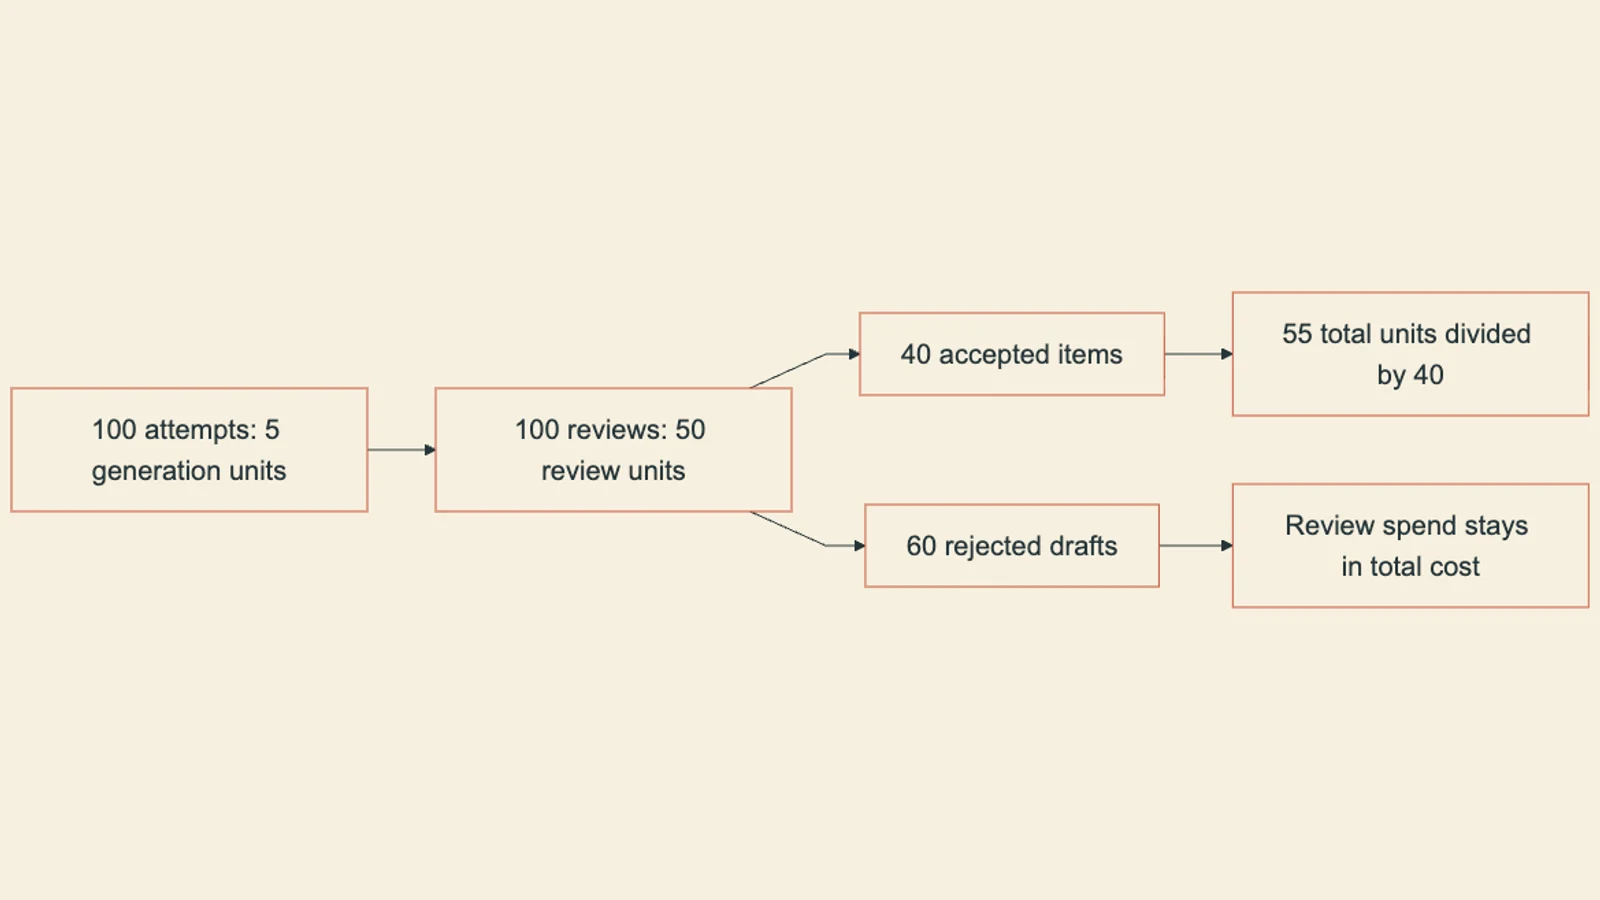
Now suppose someone reports that a new setup halves generation cost per attempt while acceptance falls to 40 out of 100. Review cost per attempt is unchanged, since every attempt, accepted or not, still gets reviewed.
generation cost = 5 (halved from 10)
review cost = 50 (unchanged, still 100 attempts reviewed)
total cost = 5 + 50 = 55
cost per accepted item = 55 / 40 = 1.375
Cost per accepted item rose from 0.75 to 1.375, an increase of roughly 83 percent, even though the generation line on the dashboard shows a 50 percent saving. Here is the full sensitivity table, with acceptance rate as the variable and generation and review cost held at the stated per-attempt values:
| Attempts | Generation cost total | Review cost total | Accepted | Cost per accepted item |
|---|---|---|---|---|
| 100 | 10 | 50 | 80 | 0.75 |
| 100 | 5 | 50 | 80 | 0.6875 |
| 100 | 5 | 50 | 60 | 0.9167 |
| 100 | 5 | 50 | 40 | 1.375 |
| 100 | 5 | 50 | 20 | 2.75 |
Cheaper generation alone, in row 2, lowers cost per accepted item to 0.6875. In rows 3 through 5, falling acceptance outweighs that saving. At 20 accepted items, each costs 2.75 units. Solve (5+50)/x = 0.75 for the break-even accepted count: x = 73⅓. As a continuous rate, the threshold is about 73.33%. In an actual batch of 100, you need at least 74 accepted items to beat the baseline. With 73, the cost is 55/73 ≈ 0.7534, slightly worse; with 74, it is 55/74 ≈ 0.7432, slightly better.
These numbers are an authored teaching sensitivity table, chosen to make the arithmetic legible. They are not a benchmark, a customer result, or a production measurement, and no run has been executed to produce them; the point is the mechanism, which any team can rerun with its own figures.
The cost graph separates two measurements: spend and accepted output. A cheaper model can reduce the first while reducing the second even more. The batch view below makes the rejected attempts visible. Check that your own accounting still includes their review cost.
Why the metered number misleads
Anthropic's engineering writeup on evaluating agents makes a related point about evaluation design: agent evaluation needs to separate tasks, environments, trajectories, and outcomes, and a single aggregate score cannot substitute for domain-specific criteria and human calibration (Anthropic, "Demystifying evals for AI agents," 2026-01-09). The same separation applies to cost. Generation cost is the easy number to watch because it is metered automatically, per call, in a provider's billing dashboard. Acceptance rate is not metered anywhere by default; someone has to define the gate and count outcomes against it. When a team optimizes only the metered number, they are choosing what to look at because it is visible, not because it dominates the total.
LangChain's introduction of a tuned "perceived error" evaluator is a useful adjacent case: they built a managed evaluator meant to score conversation traces against a specific error definition, reporting that a specialized model reduced evaluation cost against frontier-model judging while exceeding it on their benchmark (LangChain, "Introducing LangSmith tuned evaluators," 2026-08-18). That reported figure is evidence about LangChain's own evaluation of their judge model, not a substitute for testing usefulness against your own human labels on your own tasks. The lesson transfers directly here: whatever acceptance gate you use for the sensitivity table above needs to be your team's actual criteria, checked against human judgment, not an assumed pass rate borrowed from someone else's report.
Watching only the per-call price of a model change is the same error as watching only inference cost in a task-level margin calculation. Acceptance rate can move in the opposite direction and dominate the result. Recompute total cost and total accepted items together before calling anything cheaper.
The queue that actually limits throughput
Once acceptance rate enters the picture, a second question follows: which stage is actually constraining how much accepted work the team produces per week? Take a hypothetical review capacity of 40 reviewer-hours available in a period, with each review taking a stable number of minutes. A lower acceptance rate does not just raise cost per accepted item under that constraint. It also means more reviewer-hours get spent on drafts that end up rejected, which reduces the total number of accepted items the team can ship in that period, independent of the cost arithmetic.
Consider two hypothetical review-time lists, each with a mean of 4 minutes: [4, 4, 4, 4, 4] and [1, 1, 1, 1, 16]. Suppose the receiving team requires escalation whenever a single case exceeds 10 review minutes. The first list satisfies the rule on every case. The second list has identical average review time but contains one case at 16 minutes, which breaks the rule despite the mean looking exactly the same.
cases_a = [4, 4, 4, 4, 4]
cases_b = [1, 1, 1, 1, 16]

def mean(xs):
    return sum(xs) / len(xs)

def worst_case_violates(xs, limit):
    return max(xs) > limit

print(mean(cases_a), mean(cases_b))          # 4.0 4.0
print(worst_case_violates(cases_a, 10))       # False
print(worst_case_violates(cases_b, 10))       # True
Both lists print a mean of 4.0. Only the second triggers the escalation check, because max() catches the 16-minute outlier that the mean averages away. This is a five-value illustration built to make the point legible, not an estimate of a production p95; a real percentile claim needs a declared method and a stated sample size large enough to support it, which five invented numbers cannot provide.
Record generation cost and review cost per attempt, separately, for every attempt in the period, whether accepted or rejected.
Divide total cost (generation plus review) by the count of accepted items, not by the count of attempts, every time acceptance rate is reported to have moved.
For a rule applying to every case, check every duration and escalate each breach. A percentile can describe the workload distribution, but cannot establish that no case exceeded the limit.
Making the transfer decision concrete
Three separate decisions sit on top of this arithmetic, and they belong to different people. Someone deciding whether to route work to a cheaper-per-call model needs the break-even acceptance rate worked out above: below it, the cheaper model costs more per accepted item, not less. Someone accepting an integration into a live workflow needs a stated, acceptable review workload defined before the integration is promised, not discovered afterward when reviewers are overloaded. Someone examining reliability needs to compare mean and tail review times side by side, because a stable mean can conceal an escalation-triggering tail exactly like the two five-value lists above.
| Decision | Question to answer | Evidence needed |
|---|---|---|
| Model or prompt routing | Is the break-even acceptance rate met on comparable tasks? | Attempts, acceptance count, generation and review cost per attempt |
| Integration commitment | What review workload can the receiving team sustain? | Stated per-case time limit and reviewer capacity, agreed before launch |
| Reliability check | Which individual cases exceeded the escalation limit? | Per-case durations and escalation records; a percentile alone cannot answer this |
Check the decision
What would change this conclusion
This arithmetic is falsifiable in specific ways, and stating them keeps the claim bounded. If review cost per attempt is not fixed, for example if rejected drafts get a faster, cheaper triage review than accepted ones do, the total cost term changes and the break-even acceptance rate shifts. If acceptance criteria are not held constant between the two setups being compared, say the newer model is being judged against a looser gate, the comparison is no longer measuring the same thing and the sensitivity table does not apply as computed. If review time scales with draft length rather than staying constant per attempt, the review cost line in the table needs to become a function of output size, not a flat per-attempt number. Any of these would require rebuilding the table with the corrected assumptions stated explicitly, and none of them changes the underlying method: price both stages, track acceptance as its own variable, and recompute the ratio rather than trusting either input in isolation.
Before trusting any claim that a model swap saved money, pull your own attempt count, acceptance count, and cost figures for generation and review into the same four-column shape as the table above, for one comparable task type. If the acceptance rate moved at all, the savings claim needs to be recomputed, not assumed.
Work through the task-level margin case that this queue-level break-even builds on, including how to separate task, stream, and standing capacity costs.