
Choose what your AI workflow baseline measures
Suppose a colleague shows you a status update generated in three minutes. Writing the update manually used to take twelve minutes, from opening the tracker to sending an accurate message. The apparent saving is nine minutes, a 75% reduction in elapsed time. Before accepting that comparison, check where the three-minute timer started and stopped. If it covered generation alone, setup, checking and corrections still need to be counted.
An AI workflow baseline records a complete unit of work, the conditions under which it was done, and the rule for accepting the result. For a status update, acceptance might require correct figures, the relevant exceptions and delivery to the intended recipient. Use that same rule for the manual and assisted versions. A fast draft that still needs correction has not yet reached the finish line.
The mechanism: four phases hiding inside one task
Take an ordinary knowledge-work task: drafting a client status update from a project tracker. Suppose the manual version takes 12 minutes end to end: reading the tracker, writing the update, checking it against the numbers, sending it. Now an AI assistant enters the picture. The generation step itself, the model producing a draft, takes 3 minutes. That's the number someone will quote. In this hypothetical serial workflow, four phases occupy the critical path. The figures below measure elapsed minutes to completion; they do not yet measure how much human attention each phase requires:
| Phase | What happens | Hypothetical minutes |
|---|---|---|
| Setup | Configure the prompt, connect the tracker data, adjust formatting rules | 6 |
| Work | The model generates the draft (the part usually reported alone) | 3 |
| Review | A human checks the draft against the tracker for accuracy | 4 |
| Repair | Correct the draft and deliver the accepted update | 2 |
| Total assisted | 15 |
The assisted run takes fifteen elapsed minutes against the twelve-minute manual baseline: three minutes longer on this run. The number that gets repeated in a meeting, "three minutes instead of twelve," was never a comparison of the same unit of work. It compared a fragment of the assisted process against the whole of the manual one.
The next measurement should distinguish reusable setup from recurring work. It should also record whether review and repair change with experience or task difficulty. Keep those changes visible across repeated runs. They can alter the conclusion without changing the model's generation time.
Both branches of the diagram must reach the same accepted result. The minutes-baseline lab in the ZEO ITAM course starts with a card recording each element, its minutes, category, execution mode and disturbances. Build and setup work count on that card. This article extends that decomposition into an assisted-work comparison with explicit task volume and case mix.
The model may generate unattended while a person does other work. Count that interval when measuring completion time, but measure human attention separately before claiming labor savings. If phases overlap, summing their durations also overstates elapsed time; use the actual start and finish timestamps for the complete task.
| Decision | Quantity to measure | What the current example establishes |
|---|---|---|
| Will the recipient get the update sooner? | Elapsed time until an accepted update is delivered | Fifteen versus twelve minutes in the serial fixture |
| Does the process free a person's time? | Hands-on minutes across all attempts and corrections | Still unmeasured in this fixture |
| Does the change reduce operating cost? | Human effort, tool charges and allocated setup cost | Needs a separate cost calculation |
Setup cost amortizes, or it doesn't
The 6 minutes of setup in the table above look like a one-time tax, and if the task only runs once, it is. But most real workflows repeat. Suppose this status-update task runs 40 times a month. If the setup only has to happen once, and each subsequent run only costs work, review and repair, 9 minutes, then the first run costs 15 minutes and the next 39 cost 9 each, for a monthly total of 15 + (39 × 9) = 366 minutes. The manual equivalent for 40 runs is 40 × 12 = 480 minutes. Under those assumptions, the modeled saving is 114 elapsed minutes across the month, or 23.75%. It depends on achieving all forty accepted outputs with one setup session and nine recurring minutes per output.
Compare that to reporting "3 minutes instead of 12" from a single run. That framing hides both the setup cost and the fact that savings, if they exist, only show up in aggregate. A baseline worksheet that records task volume alongside per-phase minutes is what turns "it felt faster" into a number you could defend to someone skeptical of the whole idea. Anthropic's agent-evaluation guidance distinguishes tasks, graders, trajectories and outcomes. Here, the acceptance rule defines the outcome that the timer must include. Our phase-accounting example is an application of that distinction; it is not a timing result reported by Anthropic.
Case mix can manufacture a saving that isn't there
There's a second, subtler way a baseline gets distorted, and it doesn't involve inflating the assisted side at all. It involves changing which tasks get measured.
For a separate hypothetical example about human effort, suppose ordinary tasks in a workflow cost 5 hands-on minutes each and exception tasks (the ones needing real judgment, unusual data, or a correction) cost 20 minutes each. In Month A, out of 100 tasks, 80 are ordinary and 20 are exceptions: 80×5 + 20×20 = 400 + 400 = 800 minutes, an average of 8 minutes per task. In Month B, the mix shifts to 95 ordinary and 5 exceptions, same 100 tasks, same per-task performance in each category: 95×5 + 5×20 = 475 + 100 = 575 minutes, an average of 5.75 minutes per task.
The average dropped from 8 to 5.75, an apparent 28.125% reduction, and nothing about how any individual task was handled changed at all. The entire gain came from routing fewer exceptions into the measured pool, perhaps because a filter upstream quietly redirected the harder cases elsewhere, or because a different team absorbed them. If you reweight Month B's per-category numbers back to the 80/20 mix, you get the same 8-minute average as Month A. The productivity claim evaporates the instant you check whether the mix stayed constant.
Report the count and average time within each category alongside the combined result. A change in the combined average can come from a different mix, different per-category performance, or both. Reweighting holds one of those factors constant so you can inspect the other.
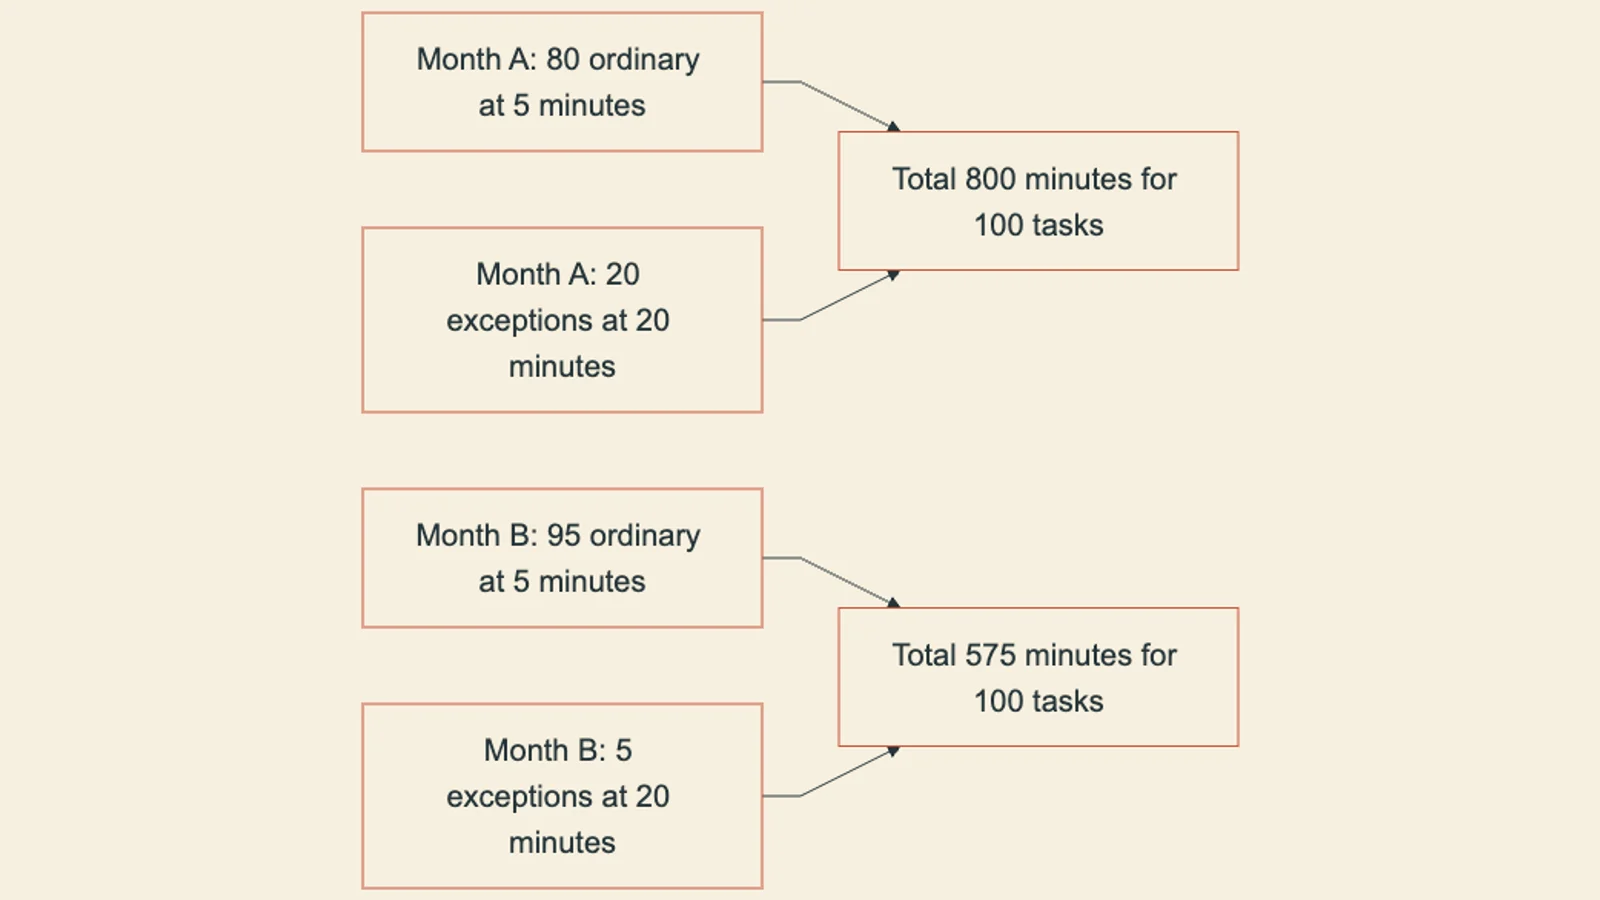
The per-category times are unchanged in both months. Use the comparison to check whether your own average fell because the workflow improved or because easier cases entered the sample.
If reweighting two periods to the same task mix erases the entire measured gain, the gain was never about the work getting faster. Check the mix before reporting the average.
A checkpoint on the core distinction
Check the decision
Building your own baseline worksheet
If you want to apply this to a real workflow rather than the hypothetical status-update example, the worksheet needs four columns before you write down a single minute: task volume (how many of this task happen per period), acceptance rule (what counts as an accepted output, stated in advance, not decided after seeing the result), phase minutes (setup, work, review, repair, timed separately), and case category (ordinary or exception, so mix shifts show up).
Write down, before running anything, what a correct output looks like for this task. If you can't state it, you can't later claim the assisted version met it.
Clock setup, generation, review and repair as distinct intervals. Do not fold review time into generation time even when they happen back to back.
State how many times this task runs per period, and what fraction fall into ordinary versus exception categories, before comparing averages across periods.
The course lab's baseline card supplies the starting method: break work into observable elements, clock them and retain disturbances. The volume and case-mix columns above are additions for this comparison. Keep a link from each summarized total back to those raw element records, so another person can reproduce the result and see which intervals were included.
Check what would change the decision
A baseline claim built this way is falsifiable in three concrete ways, and knowing them tells you what to check before trusting someone else's number. First, if the assisted total (setup plus work plus review plus repair) exceeds the manual baseline on a single comparable task, the claimed saving is false for that run, full stop. Second, if amortizing setup across a stated volume still leaves the assisted total higher than the manual equivalent at that volume, there is no saving at that scale, whatever the per-run generation number suggested. Third, if reweighting two measurement periods to an identical ordinary-to-exception mix erases the reported average improvement, the original claim was a case-mix artifact rather than a workflow change. Any of these checks can be run by someone else with the raw phase-level numbers, which is exactly why the worksheet records phases and mix rather than a single average.
Start with one recurring task whose output you can judge consistently. Record its current steps before changing the process, then repeat the measurement with assistance. Keep the failed attempts and corrections in the record. The first comparison will tell you which phase to investigate next; a broader claim needs repeated observations across the task mix you actually handle.
The baseline worksheet lab in this course walks through instrumenting one real manual workflow before any automation claim is made about it.