

What a cache-read counter tells you
A response reports 2,000 cache-read tokens. That is evidence of reused input computation according to the provider's accounting. It does not give the request another 2,000 tokens of context capacity, and it does not measure the time a person waited for the answer.
Anthropic's prompt caching documentation describes reusing computation for an unchanged prompt prefix. That can reduce the work and charge associated with processing the prefix again. The full input still counts toward the model's context limit. To evaluate caching, record context occupancy, billed usage and client-observed latency separately.
Prompt caching measurement needs separate counters
The course lesson on caching, context and cost separates stable shop policy from changing inventory. Extend that scenario with hypothetical counts: 2,000 tokens of policy and tool definitions, followed by 600 tokens of fresh inventory and a request. These counts illustrate accounting; they are not measured API usage. Before trying them on a model, check its minimum cacheable prefix length. A 2,000-token prefix is too short for some models.
Here is why three separate instruments are needed rather than one:
| Quantity | What answers it | What confuses it |
|---|---|---|
| Context occupancy | Total input tokens plus reserved output, checked against the model's stated limit | Assuming a cache hit shrinks the input; it does not |
| Billed usage | The provider's usage object, broken into ordinary input, cache-write, cache-read and output categories | Adding cache-read and ordinary input without checking for overlap, which double-counts tokens |
| Latency | Elapsed wall-clock time from request to complete response, measured on the client | Assuming a fast response proves a cache hit; network conditions and load also move latency |
If the 2,000-token policy is cached and 600 fresh tokens are added, the request still contains 2,600 tokens of context. A cache-read charge might apply to some or all of the 2,000, at whatever rate the current price schedule sets. Neither fact changes the 2,600-token occupancy. The reused prefix remains part of the input the model can attend to.
Build the cold/warm comparison properly
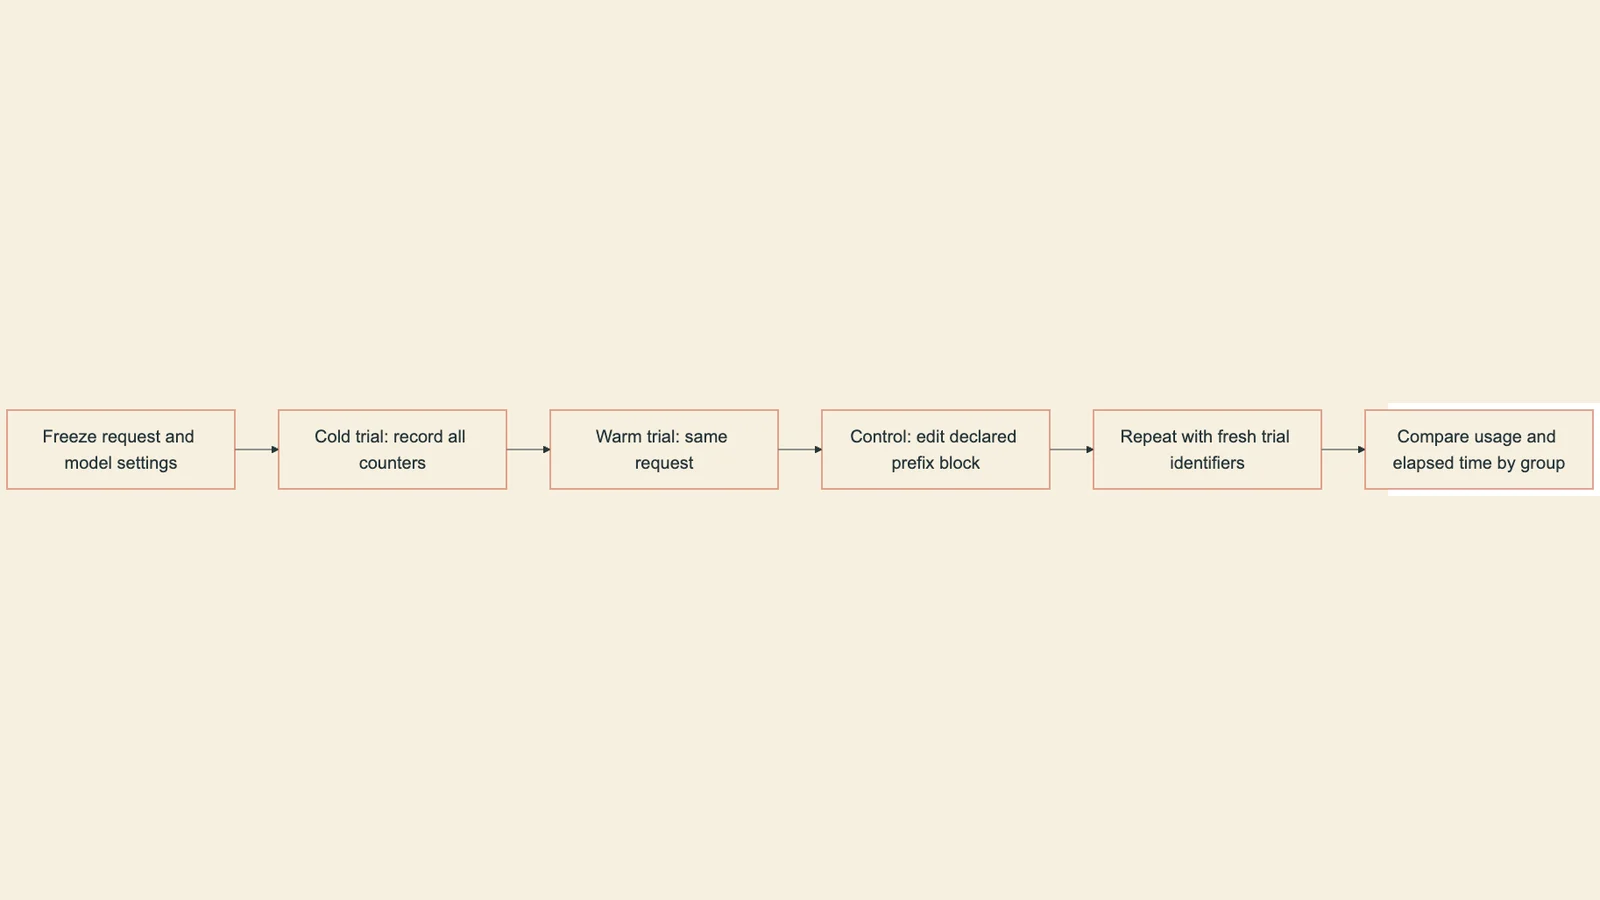
The right way to test a cache hypothesis is a controlled cold/warm comparison, not a single call. Here is the ordered version of that experiment, kept deliberately small enough to run and check by hand:
Hold the operating policy, tool definitions, model, sampling settings and output limit constant. For the first latency comparison, keep the tail identical too. Then test changing inventory as a separate workload condition. A changed prefix is useful as an invalidation control, but should not be mixed into the unchanged-prefix group.
Make the first call with a prefix the provider has not seen recently. Record, as separate columns: request identity (a label or timestamp), total input tokens, cache-read tokens, cache-write tokens if reported, output tokens, and elapsed seconds measured by your own client, not a value the model reports about itself.
Repeat the full request after the initial response has begun and a cache entry can exist. Record the same fields. Confirm the entry remains within its lifetime and that the prefix meets the selected model's eligibility rules. Treat a reported cache read as an observation, not an outcome guaranteed merely because this is the second call.
Change content inside the prefix at a declared position. Record every cache breakpoint and any unchanged earlier prefix that could still be reused. Anthropic checks cumulative prefixes and can look back for previously written entries, so changing a later block does not imply that every cache-read count must become zero. Predict which part can still match before reading the usage result.
Look at context occupancy, usage category, and elapsed time for all three calls side by side. Do not average latency across cold, warm and changed-prefix calls; they are testing different things and an average would hide the comparison you built the experiment to see.
This is a proposed API experiment, not a report of measured caching performance. Record the model identifier, API settings and retrieved documentation version alongside the request hashes. Check field meanings and eligibility rules for that exact provider before running it.
The graph separates three observations from the same request. Use the sequence below to label experimental groups before collecting results. Repeat the cold, warm and changed-prefix comparisons across several trials; one call in each group cannot establish a reliable latency improvement. Keep output token counts visible because longer generated answers also take time.
Reading the numbers without inventing a price
Once the three calls return, the natural next move is estimating cost. That requires a rate schedule, and rate schedules change, so any number used here is a labeled teaching rate, not a current price. Using a small accounting function makes the mapping explicit and exposes the double-counting trap:
def estimated_cost(usage, rates_per_million):
    """usage: dict with keys like 'input', 'cache_read', 'cache_write', 'output'
    rates_per_million: dict of the same keys, in cost units per million tokens
    Categories must be non-overlapping counts, not raw totals that include
    cache-read tokens twice."""
    missing_rates = set(usage) - set(rates_per_million)
    if missing_rates:
        raise ValueError(f"Missing rates for: {sorted(missing_rates)}")
    if any(count < 0 for count in usage.values()):
        raise ValueError("Token counts cannot be negative")
    if any(rate < 0 for rate in rates_per_million.values()):
        raise ValueError("Rates cannot be negative")
    return sum(
        count * rates_per_million[category]
        for category, count in usage.items()
    ) / 1_000_000

# Hypothetical teaching numbers only, not a provider quotation
usage = {"input": 600, "cache_read": 2000, "output": 150}
rates = {"input": 2.0, "cache_read": 0.2, "output": 4.0}

print(estimated_cost(usage, rates))
The expected result is 0.0022 cost units: (600 × 2.0 + 2000 × 0.2 + 150 × 4.0) / 1,000,000. The three contributions are 1200, 400 and 600 before dividing by one million. The function rejects a usage category with no rate instead of silently dropping it from the bill estimate.
Normalize provider fields before calling it. If an API reports an input total inclusive of cached tokens, derive non-overlapping ordinary-input and cached-input counts using its documented definitions. If the categories are already disjoint, subtracting cache reads again would undercount. Anthropic's input_tokens, cache_creation_input_tokens and cache_read_input_tokens are separate categories; do not import another API's inclusive-total interpretation into them. Mixed cache-write lifetimes may require separate rate categories too.
This calculation tests arithmetic on supplied numbers. It does not establish what a live account will be billed, and floating-point arithmetic here is sufficient for an illustration rather than a ledger. Use your billing system's rounding rules and numeric representation when reconciling actual charges.
Elapsed time can shrink for reasons unrelated to caching: lower server load, a smaller output, a different data center. Confirm a cache hit only from the provider's own usage fields, never from a stopwatch alone.
Diagnosing a result that disagrees with the prediction
A warm call reporting zero cache-read tokens does not support a cache-hit claim. Check the minimum eligible length, prefix identity, cache lifetime and whether an entry was available when the request began. An absent usage field is missing evidence until you establish what that API omits and why; do not silently treat it as a measured zero.
A changed-prefix call can still reuse an earlier unchanged prefix. Compare the actual read count with your breakpoint prediction. If the count appears unchanged, inspect the serialized request: perhaps the edited block was beyond the cached boundary, or an SDK assembled different bytes than expected. The counter is a reason to investigate the request, not proof that invalidation is broken.
Finally, a shorter elapsed time does not isolate caching as its cause. Output length, network delay and server load can all move the number. Repeated controlled trials can estimate the effect under the tested conditions. Report the number of trials and a declared summary method, and keep cache reads and elapsed time as separate columns even when both improve.
Checkpoint: separating the counters
Check the decision
What the receiving team actually needs to check
Use the measurements to answer the decision your team actually faces. Someone shipping a user-facing feature cares whether the person on the other end waits less; that requires the elapsed-time column above, not the usage-category column, and it requires comparing against a declared latency budget rather than an abstract "faster is better." If a voice or chat feature has a ten-second budget for the whole draft-generation step, a cache hit that shaves two hundred milliseconds off the model call does not matter if a separate tool call in the same pipeline takes fifteen seconds; the budget is blown by the slower component regardless of what the cache did. That is a scenario constraint for illustration, not a measured result from any run.
Someone responsible for reliability cares about invalidation: what happens when policy text is edited, when tool definitions are added, when the request format shifts. The changed-prefix control call in the steps above is built for exactly that question, and it should become a standing regression check, run whenever the stable prefix is edited, rather than a one-time experiment.
When explaining the result, use separate panels or a table with explicit units for context tokens, billed categories and elapsed seconds. A shared axis or an unexplained second axis can make unlike quantities appear directly comparable. State whether a latency figure covers the model call or the complete user workflow.
Field names, minimum eligible prefix lengths, expiration windows and automatic-versus-explicit caching behavior differ by provider and by model version, and they change over time. Anthropic's own documentation is the reference for its API; do not carry a field name or a rate from one provider's guide into another provider's account and assume it still applies.
A dated check before you trust any of this later
| Claim in this article | Recheck against | Last verified |
|---|---|---|
| Cache-read tokens do not reduce context occupancy | Anthropic prompt caching documentation | 2026-09-10 |
| Usage fields report cache-read separately from ordinary input | Anthropic prompt caching documentation | 2026-09-10 |
| Rates used in the cost example (2.0, 0.2, 4.0 per million) | Not a real price; illustrative only, recheck current provider pricing before budgeting | Not applicable |
Documentation pages change without notice. If you're reading this well after September 2026, reopen the source directly rather than trusting the paraphrase above.
Start with one frozen request on your authorized account. Predict the eligible prefix and expected usage categories, record the actual response fields and elapsed time, then explain each difference before expanding the experiment.
See the full worked lesson this experiment builds on, including the shop-policy example and the notebook exercise that predicts fields before running them.