
The trace that has everything and explains nothing
An agent times out halfway through a user's request. Someone on the team pulls the trace. It is thorough: the full user message, the full model output, a stack trace with the exception's arguments, millisecond timestamps. It still cannot answer the question that matters: which operation failed, at which step, under which model version, and does the same failure show up elsewhere? There is no operation ID and no step name. There is a wall of text with no anchor.
More captured content is not more diagnostic power. A trace can be dense with user data and still fail at its job, which is linking a failure to a specific step of a specific operation. The reverse also holds: a trace can drop nearly all conversational content and still explain what went wrong, if it keeps the fields that carry structure.
This matters twice over when traces feed evaluation. Agent trajectories are the raw material for eval sets and for improving an agent: which tools it called, in what order, where it stopped. Production trajectories also contain whatever users typed. The design question is how to capture enough structure to diagnose and measure, while user content stays out of the default path.
A trace and a transcript are different artifacts
A trace, as used here, is a structured record of one execution: an operation ID tying the steps together, a step name, the tool called, the model version, token counts, elapsed time, an outcome code, and a reference to a larger artifact if one exists. A transcript is the content: messages, tool arguments, model outputs. It belongs in an access-controlled store with a short retention period, referenced by the trace rather than embedded in it.
They serve different readers. Traces are read constantly, by dashboards, alerts, eval bookkeeping and anyone triaging a spike. Transcripts should be read rarely, by someone authorized for one specific failure, after the trace has said which one. Merge them and every routine query carries user content with it.
The OpenTelemetry project maintains semantic conventions for generative AI systems, with shared attribute names for spans and events in AI workloads (OpenTelemetry, generative AI semantic conventions repository, https://github.com/open-telemetry/semantic-conventions-genai). Attribute names and stability levels are still changing, so check current documentation before you commit to them in a schema. The principle stands regardless: an operation gets typed structural attributes, not an undifferentiated blob.
Fix the allowlist first
Decide once which fields a default trace may contain:
| Field | Purpose | Disclosure consideration |
|---|---|---|
operation_id | Ties every step of one run together | Can link records to a person; restrict access |
step | Which stage failed (model_call, tool_call) | Must come from a fixed set, never from input text |
model_version | Which model answered the step | Low risk; still assess |
input_tokens, output_tokens | Cost and context size per step | Low risk; useful for evals and budgets |
elapsed_ms | How long the step took | Timing can reveal activity patterns |
outcome_code | ok, timeout, validation_failed | Must come from a fixed set |
artifact_ref | Pointer to a restricted transcript, if one exists | A pointer can encode identity or access tokens; restrict it too |
Scroll horizontally to view columns.
None of these carries user text, and together they answer the practical questions: which run, which step, which version, how much, how long, what happened, and where an authorized person should look. Adding payload_text or raw_response is sometimes justified, but as a deliberate policy change with a named owner, not a default.
Here is the test you would write to check that a logging pipeline respects the allowlist. A timeout is raised, and its arguments happen to contain a user's email address and a token that must never leave the process.
import io
import json
import logging
import re
import traceback

ALLOWED_KEYS = {"operation_id", "step", "model_version", "input_tokens",
                "output_tokens", "elapsed_ms", "outcome_code", "artifact_ref"}


def safe_fields(data):
    result = {k: v for k, v in data.items() if k in ALLOWED_KEYS}
    if not re.fullmatch(r"op-[0-9]{1,12}", str(result.get("operation_id", ""))):
        raise ValueError("Invalid operation reference")
    for key, allowed in {"step": {"model_call", "tool_call"},
                         "model_version": {"hypothetical-v2"},
                         "outcome_code": {"ok", "timeout", "validation_failed"}}.items():
        if result.get(key) not in allowed:
            raise ValueError("Unrecognized trace field")
    for key in ("input_tokens", "output_tokens", "elapsed_ms"):
        if type(result.get(key)) is not int or result[key] < 0:
            raise ValueError("Invalid count")
    # This fixture permits no artifact pointer; a real registry needs validation.
    result.pop("artifact_ref", None)
    return result


class TraceFormatter(logging.Formatter):
    def format(self, record):
        # Deliberately excludes msg, args and exc_info from this trace stream.
        return json.dumps(safe_fields(record.trace_fields), sort_keys=True)


def fallback_trace(stream, fields):
    stream.write(json.dumps(safe_fields(fields), sort_keys=True) + "\n")


primary = io.StringIO()
fallback = io.StringIO()
logger = logging.Logger("isolated-fixture-trace")
logger.propagate = False
handler = logging.StreamHandler(primary)
handler.setFormatter(TraceFormatter())
logger.addHandler(handler)
fields = {"operation_id": "op-4471", "step": "model_call",
          "model_version": "hypothetical-v2", "input_tokens": 5120,
          "output_tokens": 0, "elapsed_ms": 30000, "outcome_code": "timeout",
          "user_email": "[email protected]"}
try:
    raise TimeoutError("fixture timeout", {"canary_token": "TOKEN-9F21"})
except TimeoutError as exc:
    logger.error("failure %s", exc, exc_info=True, extra={"trace_fields": fields})
    fallback_trace(fallback, fields)
    # Negative controls retained in memory, never sent to a logging backend.
    unsafe_args = json.dumps(exc.args)
    unsafe_traceback = "".join(traceback.format_exception(exc))
    assert "TOKEN-9F21" in unsafe_args and "TOKEN-9F21" in unsafe_traceback
for emitted in [primary.getvalue(), fallback.getvalue()]:
    assert "TOKEN-9F21" not in emitted and "[email protected]" not in emitted
    assert json.loads(emitted)["operation_id"] == "op-4471"
print("Both safe paths preserve operation ID and omit synthetic content canaries")
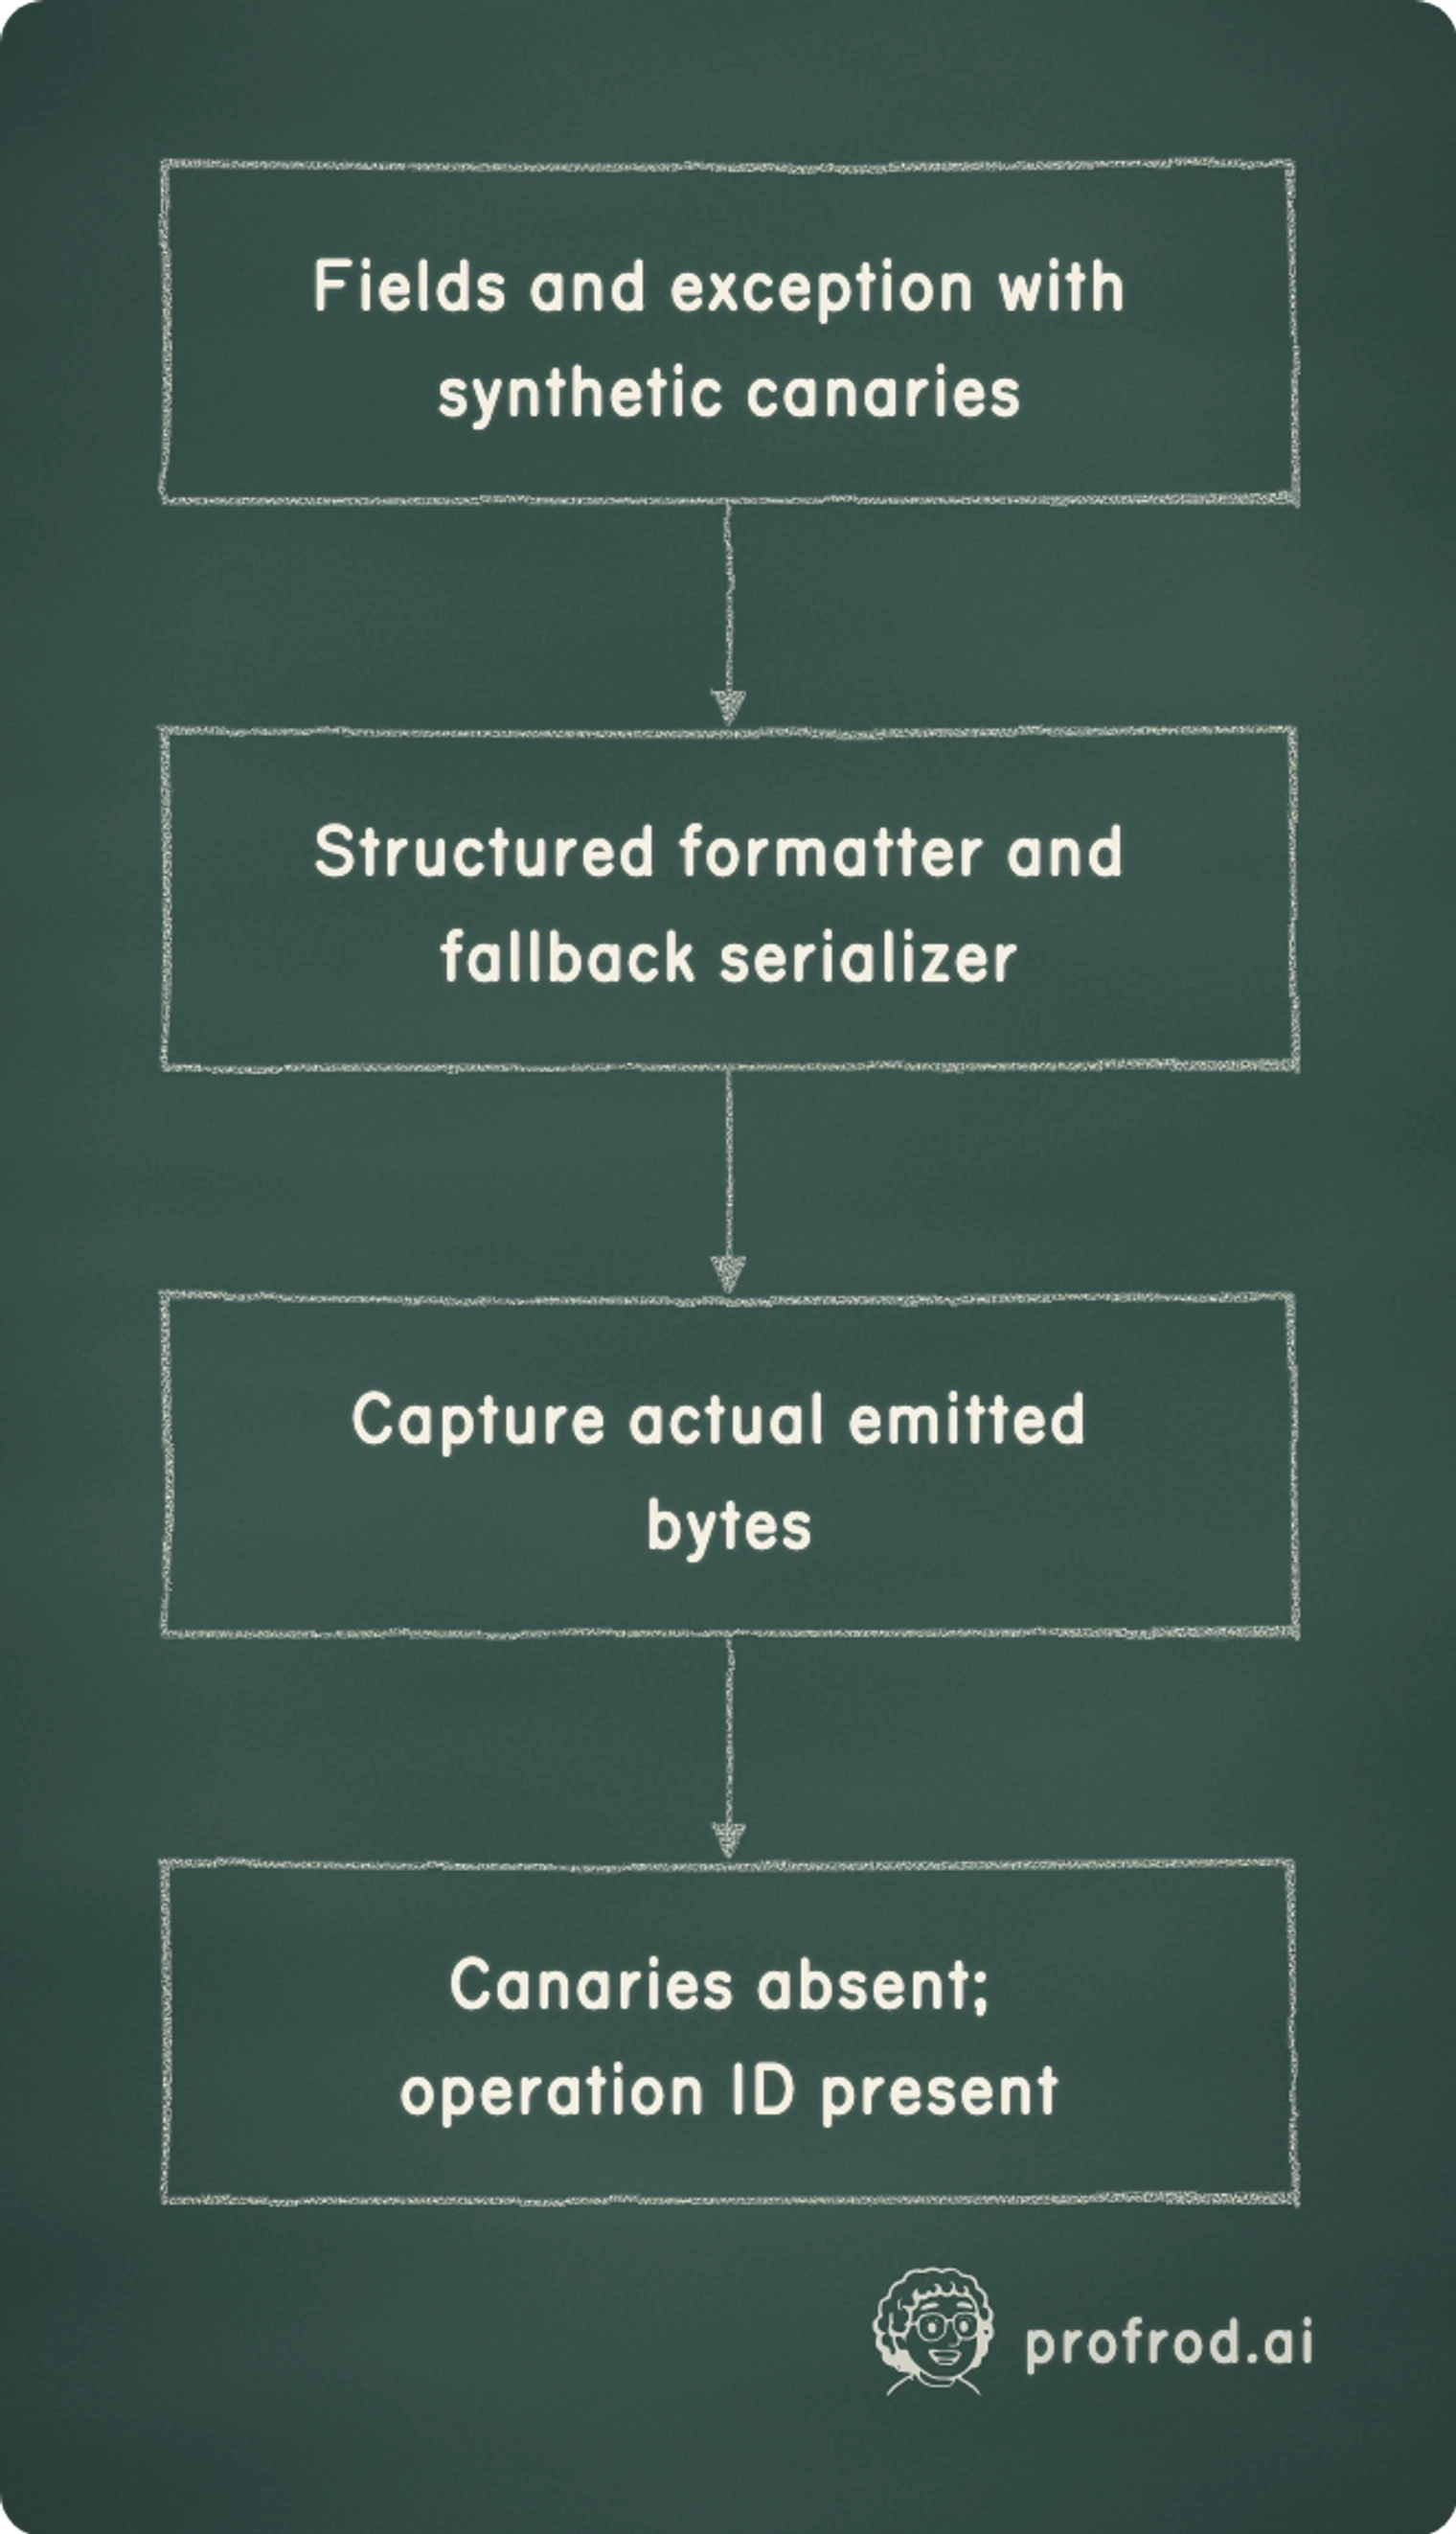
The test inspects the strings actually emitted on two paths. The formatter serializes only the validated fields, rather than filtering an attribute a default formatter would never print. The fallback path uses the same checks. The negative controls confirm that raw exception serialization would have carried the canary, and the positive control confirms both paths keep the operation ID. This is local evidence; the exporter and storage behind it need their own checks.
Where redaction breaks
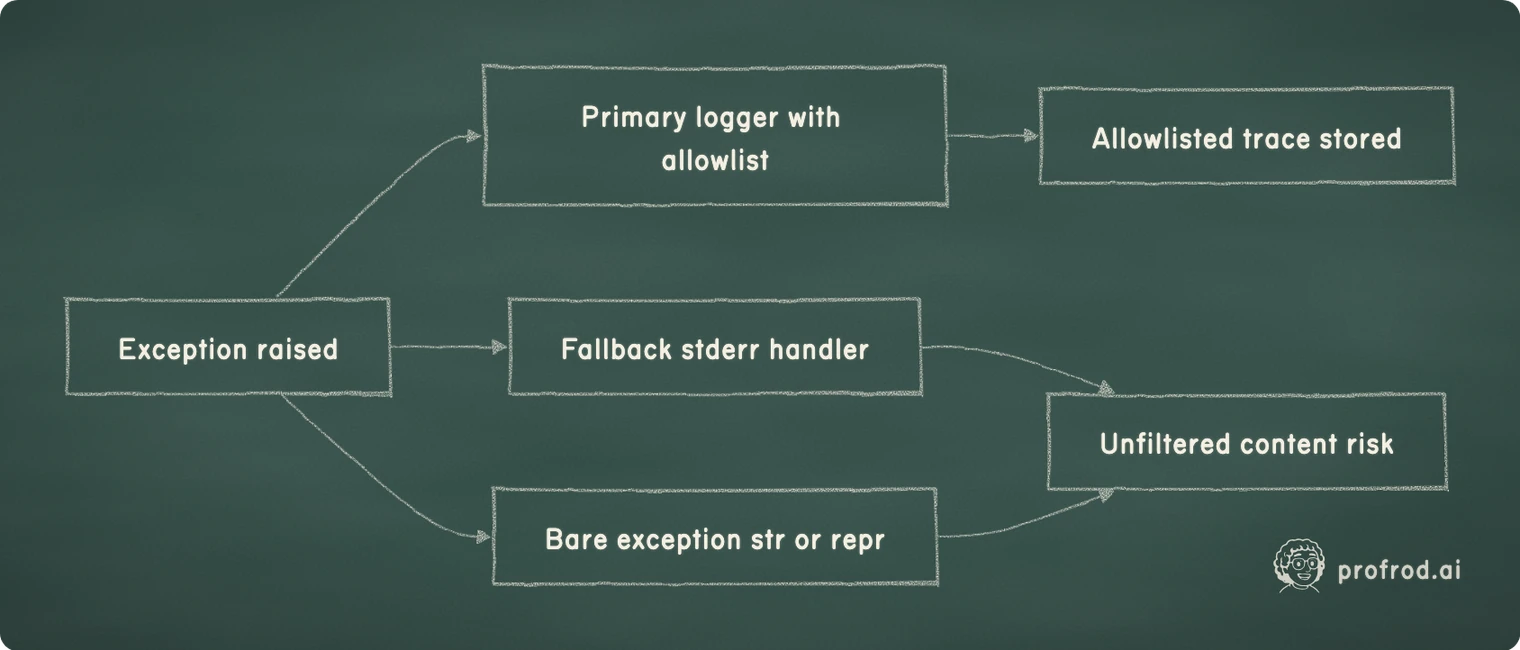
The unsafe strings in the negative controls show the general failure: redaction written for the success path and never exercised on the paths that run only when something goes wrong. Three places to check, using Python's standard library as the example:
logging.Formatter.formatException, which by default renders the full exception, arguments included. Call it on an exception built with sensitive arguments and the string carries them, whatever your allowlist says about structured fields.- Any direct JSON serialization of an exception's
argstuple, which is where extra context tends to end up. - A fallback handler, often a
stderrprint or a catch-all logger configured separately, which exists for the case where the main pipeline fails and is therefore easy to leave unaudited.
An allowlist attached to one logger changes only what that logger emits. A fallback handler, a bare print, or a second logger configured without the filter emits whatever it is given. Test every path that can run during a failure.
Audit the store by sampling
Path tests show the code you tested behaves. They cannot show that nothing else wrote to the trace store: a library upgrade, a debug flag left on, a new tool that logs its arguments. Audit the store itself.
Draw a random sample of n stored traces and scan each for sensitive patterns: email addresses, access-token formats, and the synthetic canaries your tests plant. If the true fraction of contaminated traces is q and the sample finds none, the rule of three from Chapter 16 applies:
P(no hits in n samples) = (1 − q)^n
with q = 3/n:  (1 − 3/n)^n ≈ e^(−3) ≈ 0.05
so zero hits bounds q below about 3/n at 95% confidence
n = 500:  q < 3/500 = 0.6%
The two-sided 95% Wilson interval for 0 of 500 runs up to about 0.76%. State the claim that way: "no hits in 500 random traces, so contamination is probably under 1%", not "the store is clean". Pattern scans miss what they do not look for, such as names typed into free text, so pair the scan with a manual review of a smaller sample.
From a failed trajectory to an eval case
A production failure is valuable eval material, and this is where privacy decisions meet evaluation. There are two honest routes:
- Restricted transcript, approved use. An authorized person retrieves the transcript through
artifact_ref, under your organization's rules for that data, and the resulting eval case is stored with the same restrictions and retention. - Synthetic reconstruction. From the structural trace alone, you know the tool sequence, the step that failed and the outcome code. Write a synthetic request that reproduces that shape, with no user content, and confirm the agent fails the same way. The case can then live in an ordinary eval set.
The second route is usually better for a shared eval set, and the structural trace is what makes it possible: without step names and tool sequences, there is nothing to reconstruct from.
Retention is a separate decision
What gets written and how long it lives are two separate controls. Allowlisted metadata is not automatically harmless: operation references can link records to people, and timing can reveal activity. A teaching example, to be replaced by your organization's actual requirements: structural traces kept seven days, restricted transcripts kept one day with a named owner approving access and deletion, and deletion verified rather than assumed. This is a policy sketch, not legal guidance.
Fix the allowlist before writing logging code, and draw step and outcome values from fixed sets.
Put synthetic sensitive content into exception arguments and nested payloads, and run it through every serialization path you actually use.
Confirm the operation ID survives redaction. A trace without it is private and useless.
Scan a random sample of stored traces for sensitive patterns and planted canaries, and report the bound the sample supports.
Check the decision
Why this matters in a lab
Evaluation depends on trajectories, and applied teams increasingly build eval sets from real failures. The same traces are where user data leaks if capture is careless. A team will expect you to design capture so that failures can be counted, grouped and reproduced from structure, with content handled as the exception it should be. An interviewer might ask, "How would you turn production agent failures into an eval set without copying user data?" A strong answer separates traces from transcripts, fixes an allowlist, tests exception and fallback paths with canaries, bounds contamination by sampling, and reconstructs failures synthetically where it can. For the infrastructure side of running many traced episodes at once, see state and identity behind a stateless MCP server.
What would prove this wrong
The allowlist design fails if a field's values leak content, for example a step name generated from part of the request instead of drawn from a fixed set, or an artifact_ref that is a URL containing a user identifier. It fails for failures whose cause lives in the content itself, such as a prompt injection in a document: structure shows where the agent went wrong, not why, and diagnosing it needs the restricted transcript. And a clean sample bounds contamination only for the patterns the scan detects. A passing local fixture shows the formatter and fallback work for that code path; it proves nothing about a logging library, exporter or storage layer you have not tested.
Build an evaluator around a real agent loop, save evidence that survives the conversation, and put error bars on every result.